Australia EV Surge: EV + PHEV Market Share Hits 31.6% in 2026
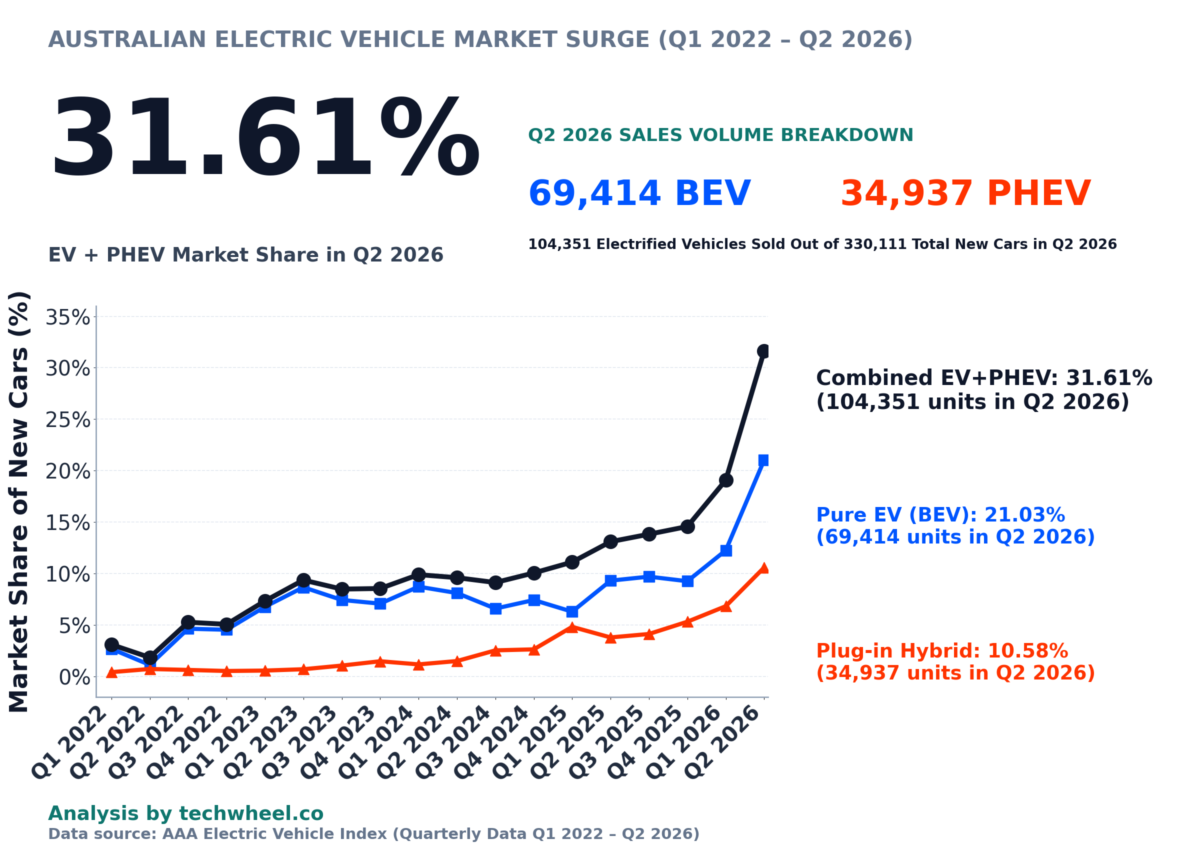
Australia’s new-vehicle market reached a historic milestone in Q2 2026. Combined sales of battery electric vehicles (BEV) and plug-in hybrid electric vehicles (PHEV) surpassed 104,000 units in a single quarter, capturing 31.61% of all new vehicle registrations nationwide.
According to official AAA EV Index data spanning Q1 2022 to Q2 2026, the Q2 2026 national market of 330,111 new vehicles comprised 69,414 pure EVs (21.03% share), 34,937 PHEVs (10.58%), 57,919 non-plug-in hybrids (17.55%) and 167,840 internal combustion vehicles (50.84%).
Quarterly EV vs. PHEV Trajectory (Q1 2022 – Q2 2026)
The quarterly progression shows sustained growth in pure electric volume alongside rapid acceleration in plug-in hybrids following new utility and SUV model releases.
| Quarter | Pure EV (BEV) | BEV Share | PHEV | PHEV Share | Total EV+PHEV | HEV | ICE | Total Market | Combined Share |
|---|---|---|---|---|---|---|---|---|---|
| Q1 2022 | 6,752 | 2.68% | 1,047 | 0.42% | 7,799 | 20,577 | 223,402 | 251,784 | 3.10% |
| Q2 2022 | 2,928 | 1.12% | 1,894 | 0.72% | 4,822 | 20,479 | 236,475 | 261,779 | 1.84% |
| Q3 2022 | 12,091 | 4.64% | 1,643 | 0.63% | 13,734 | 18,259 | 228,809 | 260,803 | 5.27% |
| Q4 2022 | 11,639 | 4.54% | 1,353 | 0.53% | 12,992 | 22,471 | 221,133 | 256,601 | 5.06% |
| Q1 2023 | 17,396 | 6.77% | 1,461 | 0.57% | 18,857 | 16,101 | 222,136 | 257,094 | 7.33% |
| Q2 2023 | 25,696 | 8.67% | 2,071 | 0.70% | 27,767 | 22,212 | 246,565 | 296,544 | 9.36% |
| Q3 2023 | 22,651 | 7.43% | 3,211 | 1.05% | 25,862 | 31,418 | 247,488 | 304,770 | 8.49% |
| Q4 2023 | 21,474 | 7.07% | 4,476 | 1.47% | 25,950 | 28,708 | 248,943 | 303,605 | 8.55% |
| Q1 2024 | 25,552 | 8.72% | 3,426 | 1.17% | 28,978 | 35,003 | 228,961 | 292,944 | 9.89% |
| Q2 2024 | 25,353 | 8.10% | 4,675 | 1.49% | 30,028 | 46,727 | 236,129 | 312,889 | 9.60% |
| Q3 2024 | 19,057 | 6.59% | 7,323 | 2.53% | 26,380 | 48,282 | 214,433 | 289,098 | 9.12% |
| Q4 2024 | 21,331 | 7.42% | 7,556 | 2.63% | 28,887 | 42,801 | 215,606 | 287,294 | 10.05% |
| Q1 2025 | 17,901 | 6.29% | 13,711 | 4.82% | 31,612 | 47,014 | 205,911 | 284,538 | 11.11% |
| Q2 2025 | 29,244 | 9.31% | 11,902 | 3.79% | 41,146 | 46,732 | 226,306 | 314,185 | 13.10% |
| Q3 2025 | 29,299 | 9.70% | 12,460 | 4.12% | 41,759 | 49,929 | 210,458 | 302,146 | 13.82% |
| Q4 2025 | 26,826 | 9.25% | 15,411 | 5.32% | 42,237 | 55,458 | 192,219 | 289,914 | 14.57% |
| Q1 2026 | 34,435 | 12.25% | 19,184 | 6.82% | 53,619 | 46,945 | 180,539 | 281,103 | 19.07% |
| Q2 2026 | 69,414 | 21.03% | 34,937 | 10.58% | 104,351 | 57,919 | 167,840 | 330,111 | 31.61% |
Top 5 Pure Electric (EV) Models: Quarterly Trends (Q1 2024 – Q2 2026)
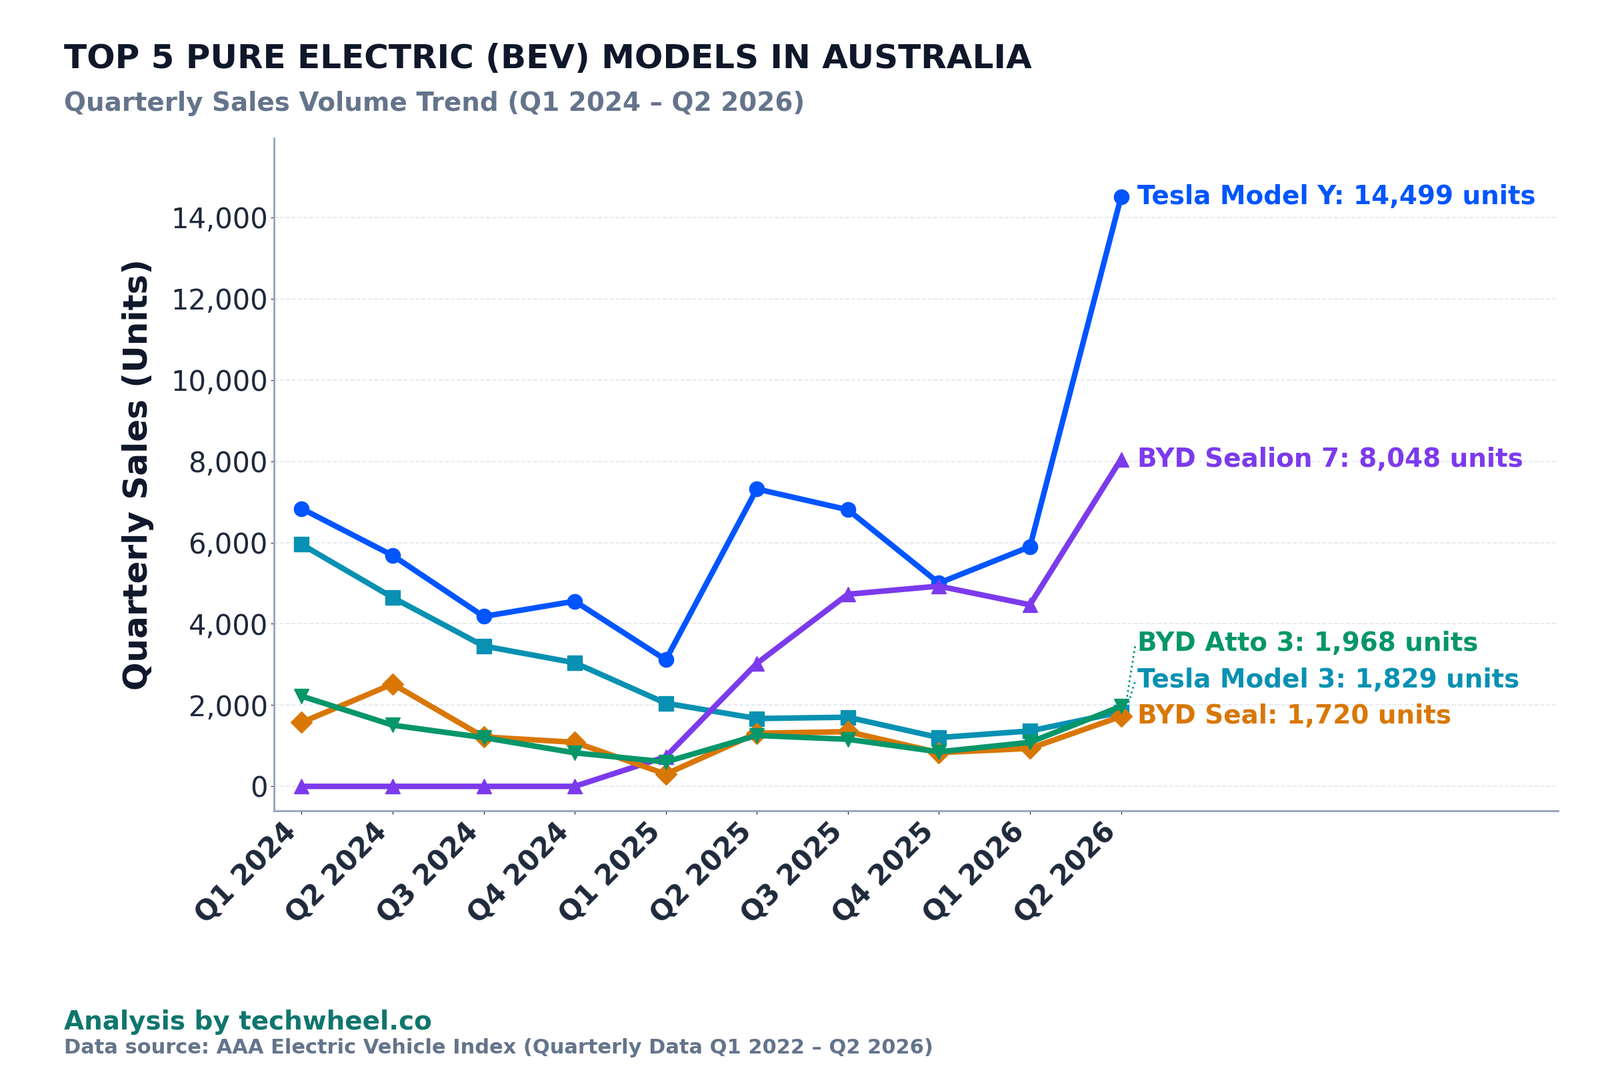
Tesla and BYD dominate Australia’s pure EV market. Between Q1 2024 and Q2 2026 the Tesla Model Y recorded 63,888 registrations – including a single-quarter record of 14,499 units in Q2 2026 – followed by the Tesla Model 3 (26,903) and the rapidly rising BYD Sealion 7 (25,926).
| Model | Q1 24 | Q2 24 | Q3 24 | Q4 24 | Q1 25 | Q2 25 | Q3 25 | Q4 25 | Q1 26 | Q2 26 | Total |
|---|---|---|---|---|---|---|---|---|---|---|---|
| Tesla Model Y | 6,835 | 5,681 | 4,181 | 4,557 | 3,114 | 7,308 | 6,804 | 5,002 | 5,897 | 14,499 | 63,888 |
| Tesla Model 3 | 5,954 | 4,646 | 3,453 | 3,039 | 2,046 | 1,678 | 1,714 | 1,201 | 1,363 | 1,829 | 26,903 |
| BYD Sealion 7 | — | — | — | — | 545 | 3,028 | 4,714 | 4,927 | 4,468 | 8,048 | 25,926 |
| BYD Seal | 1,573 | 2,519 | 1,216 | 1,114 | 332 | 1,289 | 1,215 | 829 | 934 | 1,720 | 12,831 |
| BYD Atto 3 | 2,220 | 1,506 | 1,200 | 838 | 601 | 1,288 | 1,170 | 849 | 1,084 | 1,968 | 12,664 |
Top 5 Plug-in Hybrid (PHEV) Models: Quarterly Trends (Q1 2024 – Q2 2026)
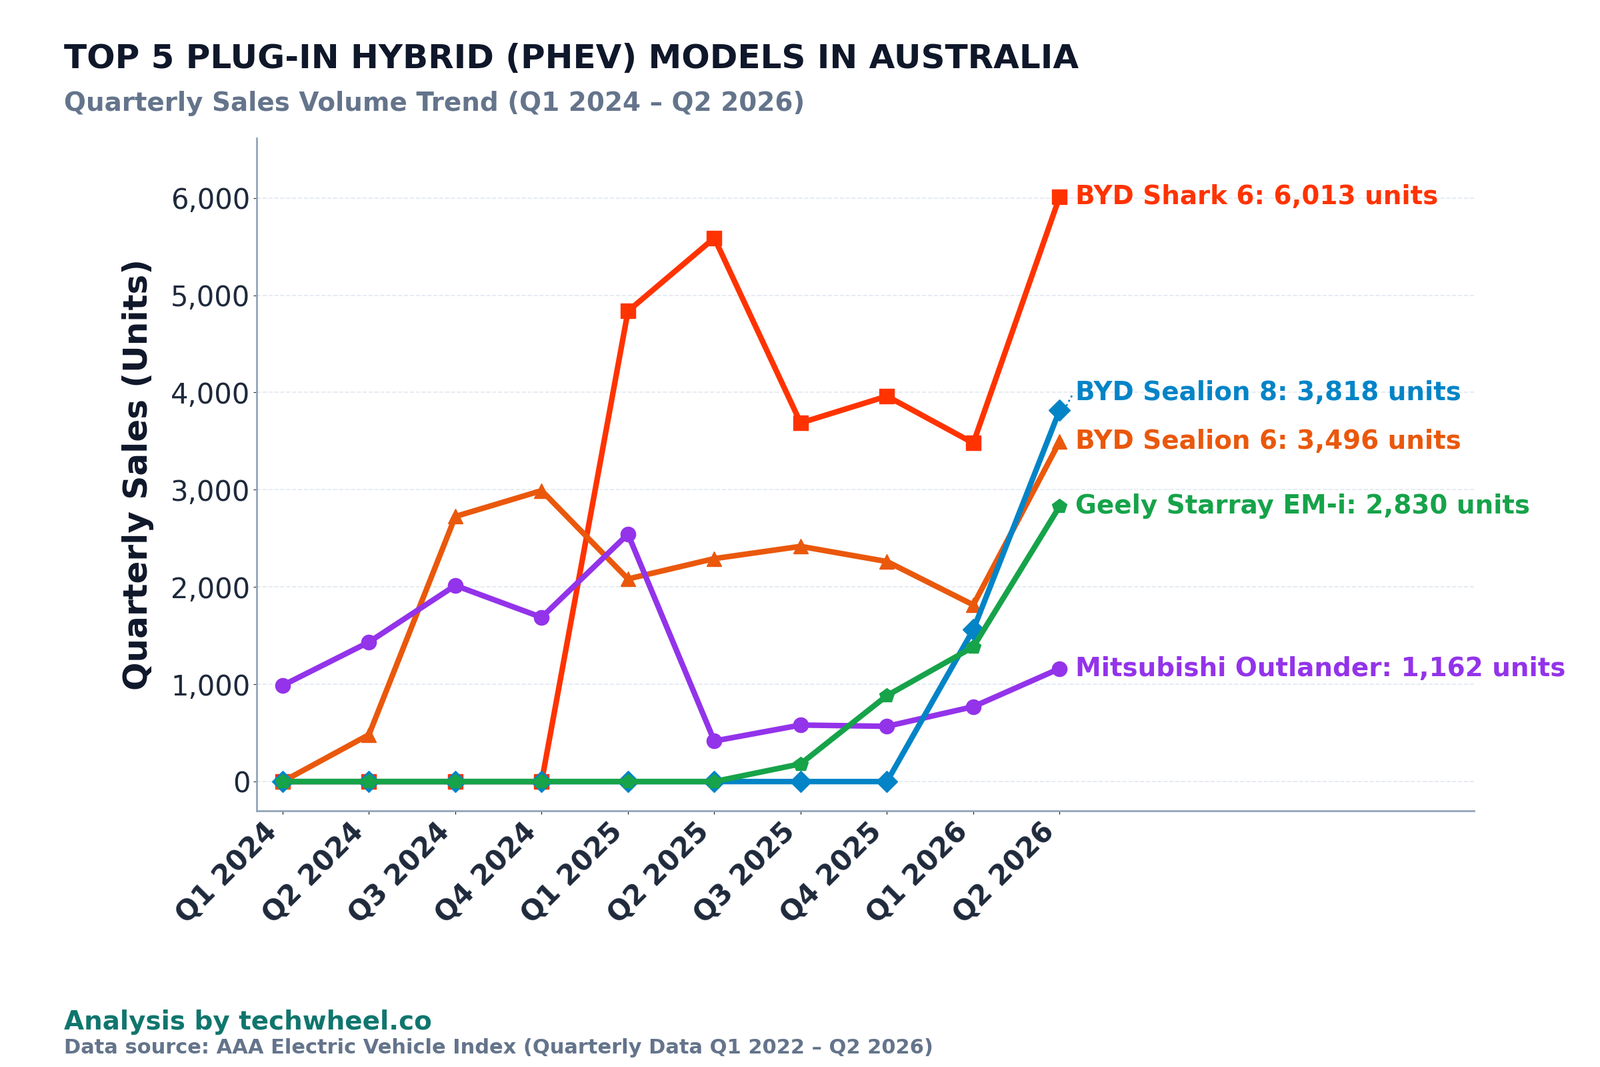
The BYD Shark 6 leads with 27,566 cumulative sales since its early-2025 entry, ahead of the BYD Sealion 6 (20,565) and the Mitsubishi Outlander PHEV (12,168).
| Model | Q1 24 | Q2 24 | Q3 24 | Q4 24 | Q1 25 | Q2 25 | Q3 25 | Q4 25 | Q1 26 | Q2 26 | Total |
|---|---|---|---|---|---|---|---|---|---|---|---|
| BYD Shark 6 | — | — | — | — | 4,836 | 5,584 | 3,681 | 3,962 | 3,480 | 6,013 | 27,556 |
| BYD Sealion 6 | — | 482 | 2,725 | 2,987 | 2,083 | 2,291 | 2,423 | 2,262 | 1,816 | 3,496 | 20,565 |
| Mitsubishi Outlander | 988 | 1,434 | 2,016 | 1,688 | 2,544 | 428 | 586 | 568 | 770 | 1,162 | 12,184 |
| BYD Sealion 8 | — | — | — | — | — | — | — | — | 1,562 | 3,818 | 5,380 |
| Geely Starray EM-i | — | — | — | — | — | — | 182 | 884 | 1,384 | 2,830 | 5,280 |
Top 10 Electrified Vehicles (Q1 2024 – Q2 2026)
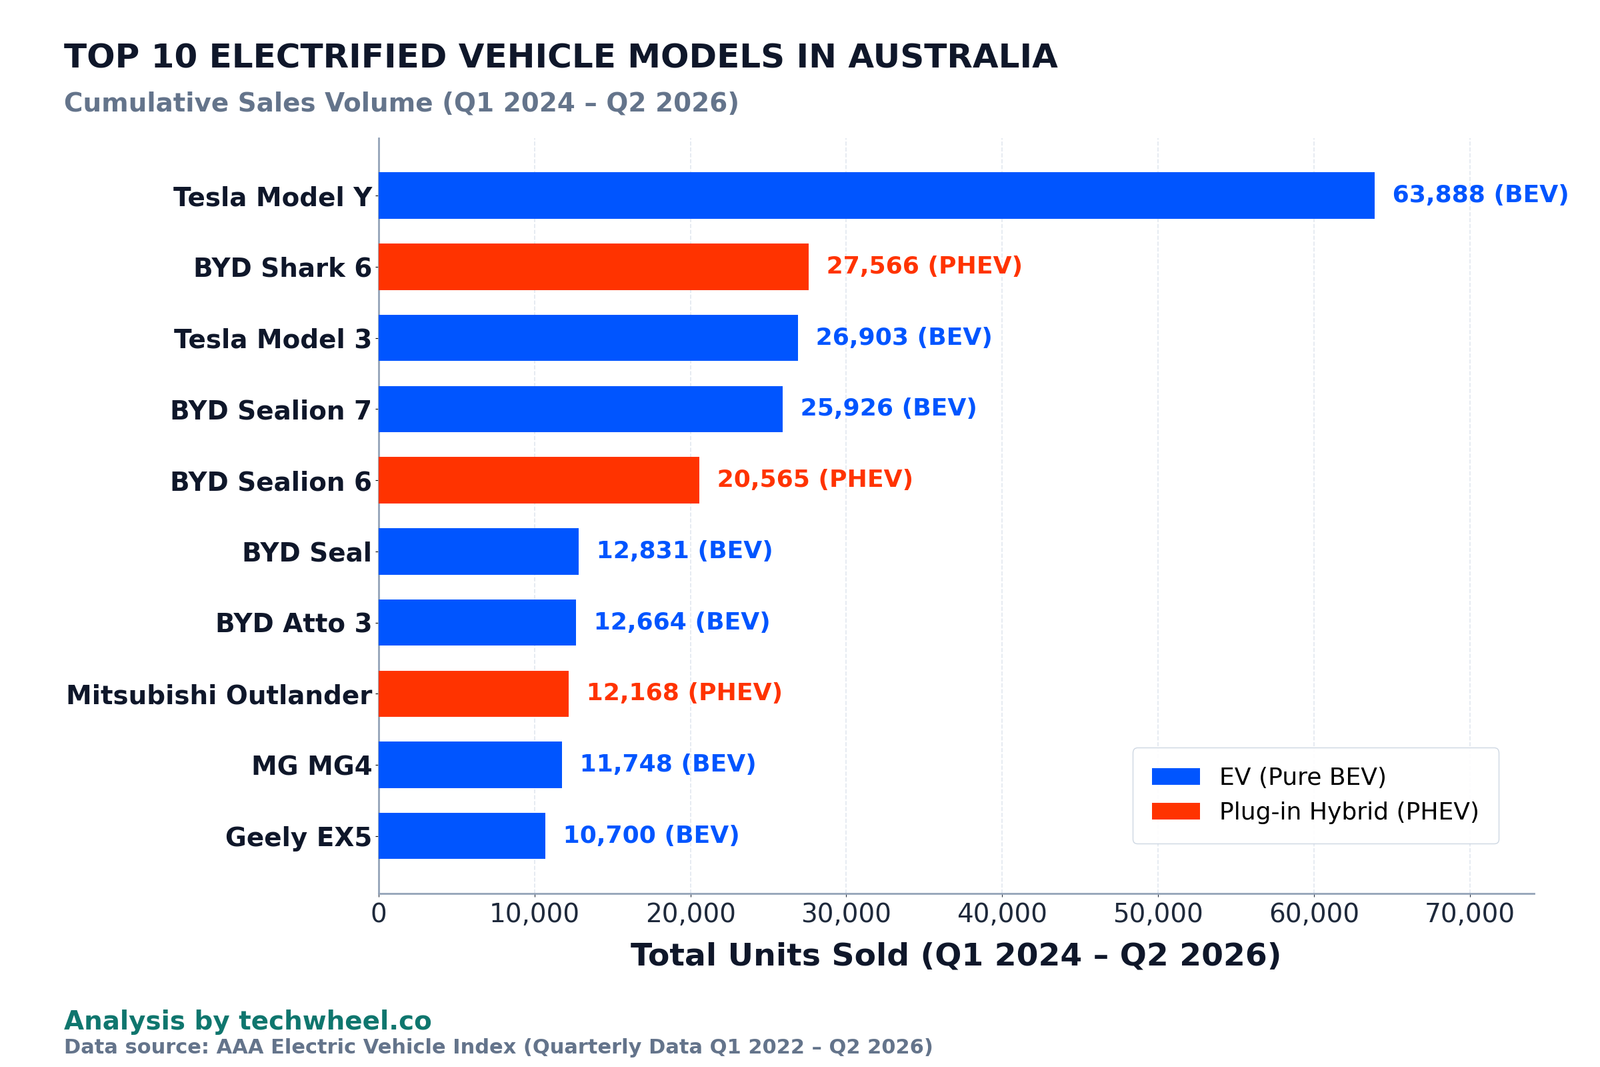
Combining BEV and PHEV cumulative sales highlights the leaders of Australia’s electrified market: the Tesla Model Y (63,888), BYD Shark 6 (27,566) and Tesla Model 3 (26,903).
| Rank | Model | Total Sales (2024–26) |
|---|---|---|
| 1 | Tesla Model Y (EV) | 63,888 |
| 2 | BYD Shark 6 (PHEV) | 27,556 |
| 3 | Tesla Model 3 (EV) | 26,903 |
| 4 | BYD Sealion 7 (EV) | 25,926 |
| 5 | BYD Sealion 6 (PHEV) | 20,565 |
| 6 | BYD Seal (EV) | 12,831 |
| 7 | BYD Atto 3 (EV) | 12,664 |
| 8 | Mitsubishi Outlander (PHEV) | 12,184 |
| 9 | MG MG4 (EV) | 11,748 |
| 10 | Geely EX5 (EV) | 10,700 |
State & Territory Adoption (Q2 2026)
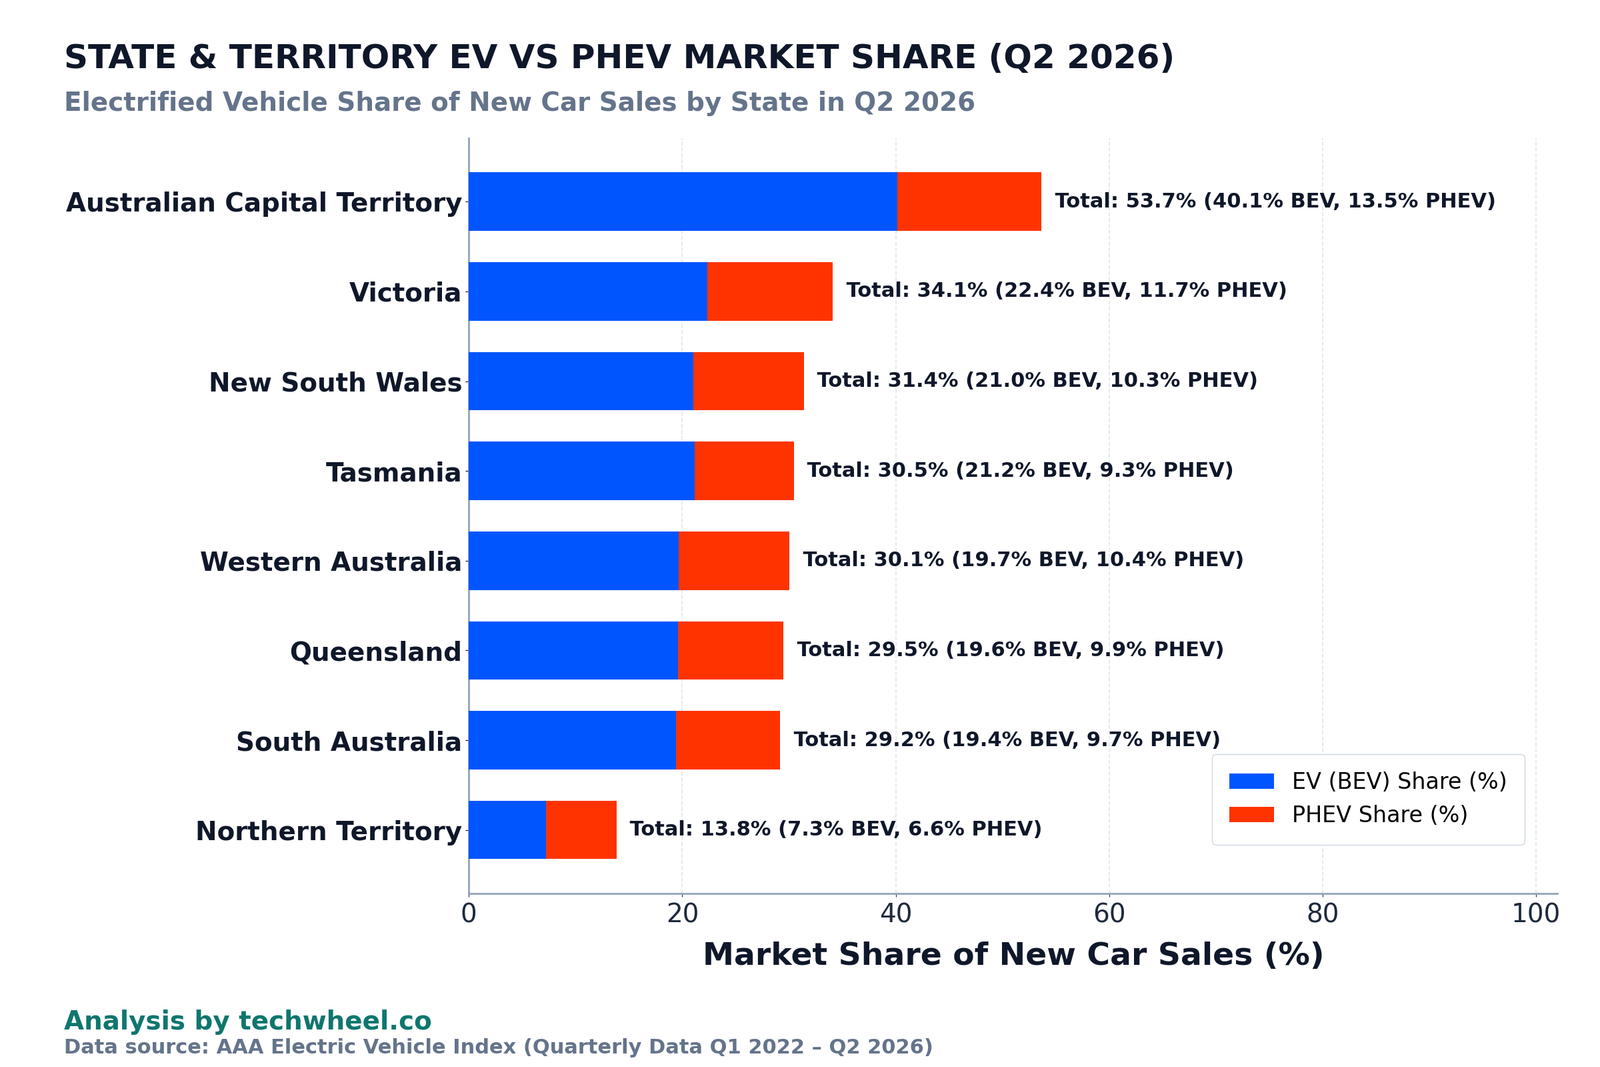
Adoption rates vary by state. The ACT leads nationally at 53.66% combined share – the only jurisdiction where electrified vehicles make up more than half of new sales – followed by Victoria (34.11%) and New South Wales (31.37%).
| State / Territory | EV Sales | EV Share | PHEV Sales | PHEV Share | Combined Share | Total Sales |
|---|---|---|---|---|---|---|
| Australian Capital Territory (ACT) | 2,060 | 40.14% | 694 | 13.52% | 53.66% | 5,132 |
| Victoria (VIC) | 19,904 | 22.37% | 10,441 | 11.74% | 34.11% | 88,966 |
| New South Wales (NSW) | 21,298 | 21.03% | 10,469 | 10.34% | 31.37% | 101,257 |
| Tasmania (TAS) | 1,127 | 21.16% | 495 | 9.29% | 30.45% | 5,326 |
| Western Australia (WA) | 6,801 | 19.69% | 3,582 | 10.37% | 30.06% | 34,541 |
| Queensland (QLD) | 13,938 | 19.59% | 7,026 | 9.88% | 29.47% | 71,139 |
| South Australia (SA) | 4,091 | 19.42% | 2,053 | 9.75% | 29.17% | 21,062 |
| Northern Territory (NT) | 195 | 7.25% | 177 | 6.58% | 13.84% | 2,688 |
| National Total | 69,414 | 21.03% | 34,937 | 10.58% | 31.61% | 330,111 |
The AAA EV Index data through Q2 2026 shows two growth drivers: sustained BEV volume expansion in medium SUVs and sedans led by Tesla and BYD, and rapid PHEV penetration in utility vehicles and larger SUVs offering dual-fuel flexibility.
With total electrified share at 31.61% in Q2 2026, Australia’s transition to low- and zero-emission vehicles continues across both metropolitan and regional markets.
All figures are quarterly new-vehicle registrations from the AAA Electric Vehicle Index (Q1 2022 – Q2 2026). National totals are the sum of all eight states and territories. Model-level totals cover Q1 2024 – Q2 2026.